Chapter 9 Circulation
Updated on September 4, 2026
This chapter covers the circulation support of micro-circulation, which supports the ECF, which supports skeletal muscle function. Circulation includes two vascular circuits that circulates blood through the systemic and pulmonary circulation. The cardiac pump that supports circulation is covered in the next chapter.
The primary goal of this chapter is an understanding of circulation in its supportive role for skeletal muscle. Circulation is critical for sustaining the micro-circulation of the ECF for cellular functions throughout the body. Without circulation cells with a high resting metabolism such as the brain and heart can only survive for minutes. The lack of delivery, and lack of removal being the first two problems that threaten cell life. Problems with circulation can limit the metabolic function of muscles.
The importance of circulation for life and function makes it a highly studied area of physiology. Since it has been highly studied it has several useful models for understanding circulation. After reviewing the important structures for circulation the chapter introduces several of the useful models (in the form of equations that demonstrate relationships).
Objectives include:
- 1.
Describe how the anatomy of the heart and blood vessels supports circulation.
- 2.
Identify cardiac anatomy structures.
- 3.
Explain and Interpret models (equations) of cardiac output, blood pressure and resistance.
- 4.
Apply equations of cardiac output, blood pressure and resistance (including Poiseuille’s Law) to explain and evaluate the function and possible dysfunction of circulation.
- 5.
Explain circulation regulation based on blood pressure regulation.
- 6.
Explain circulation distribution and cardiac index.
- 7.
Explain blood pressure regulation.
- 8.
Interpret the events of vasovagal syncope.
- 9.
Perform and interpret cardiovascular tests and measures including: Heart rate and Blood pressure
9.1 Structures of Circulation
The heart and the roots of the great vessels occupy the pericardium, which is located in the mediastinum. The sternum, the costal cartilages, and the medial ends of the third to fifth ribs on the left side of the thorax create the anterior border of the mediastinum. It is bordered inferiorly by the diaphragm, posteriorly by the vertebral column and ribs, and laterally by the pleural cavity (contains lungs). Specific cardiac structures and vessels are depicted in Figure 9.1.
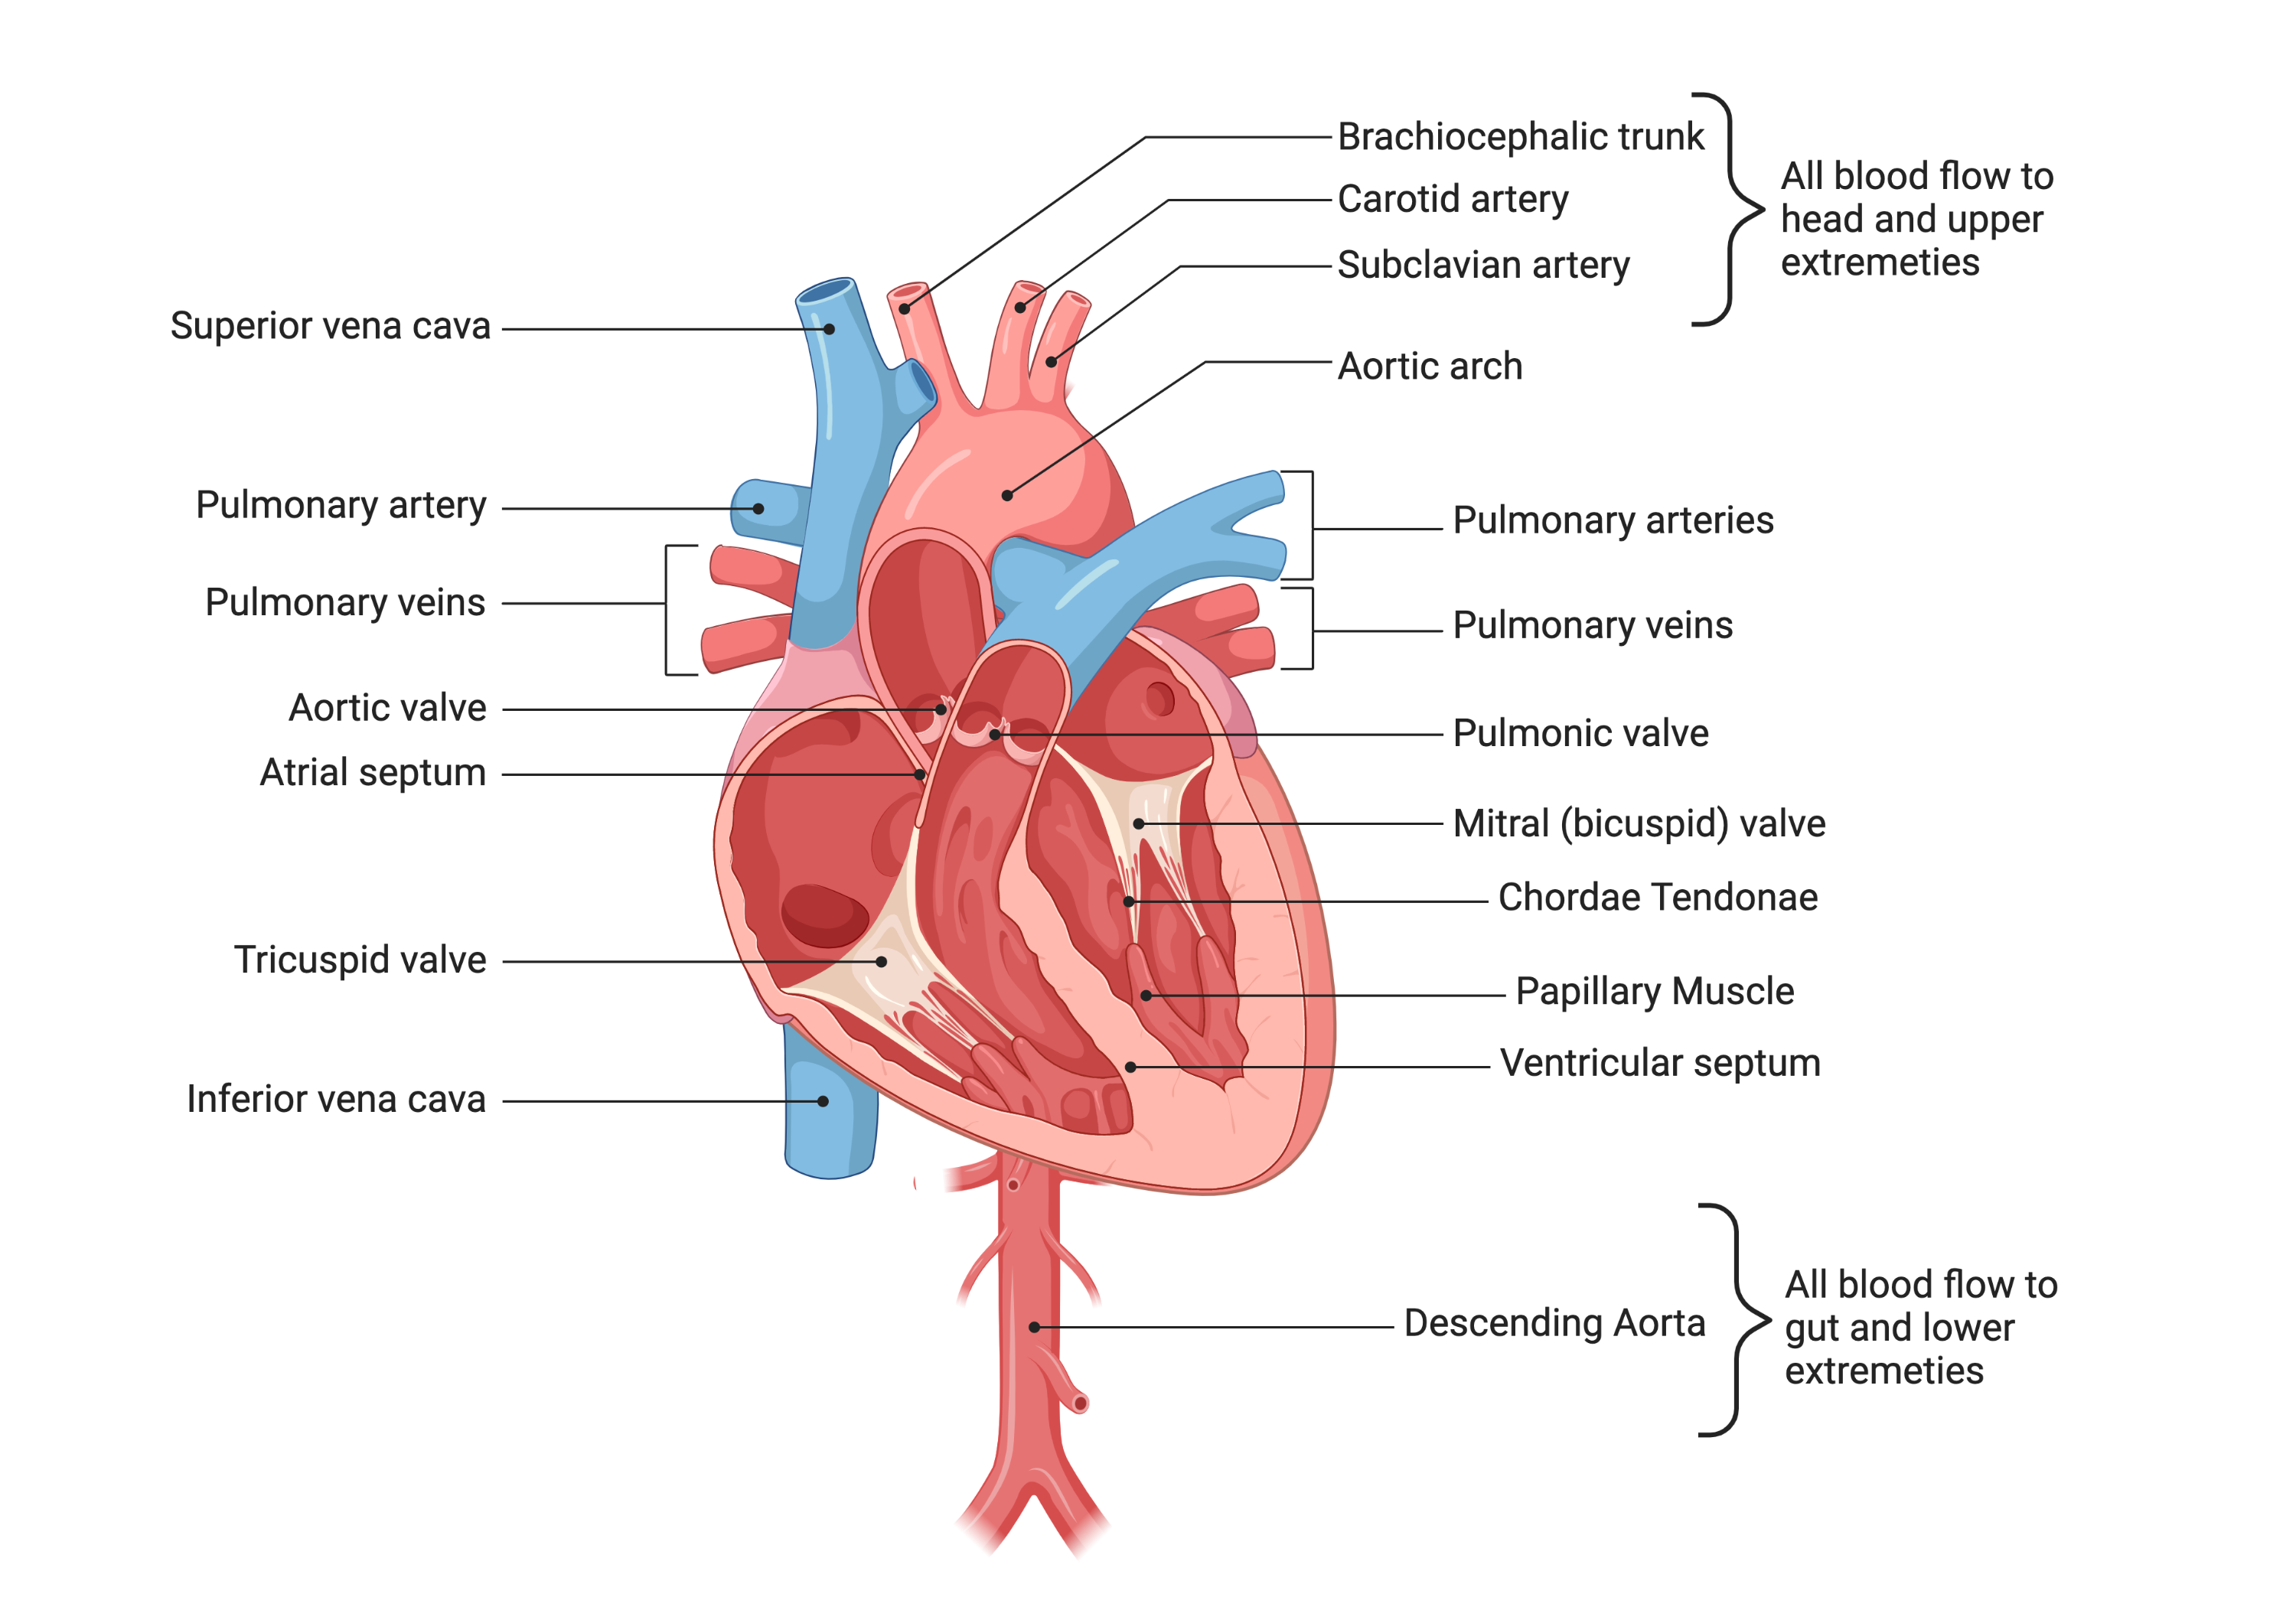
Beyond being familiar with the structure in Figure 9.1 that are utilized throughout the chapter, there are several important structural takeaways.
-
•
Structurally there are four chambers, right and left atria (RA and LA); right and left ventricle (RV and LV) (the anatomical view).
-
•
The four chambers form two primer-pumps for two circulations (right and left), RA and RV for the pulmonary circulation; and LA and LV for the systemic circulation (which includes all skeletal muscles and the heart itself) (the pump view).
-
•
Cardiac muscle (myocardium) is thicker in the ventricles than the atria; and on the left side than the right side.
-
•
The four chambers are divided into two excitation regions, RA and LA for atrial excitation; and RV and LV for ventricular excitation (the excitation view).
-
•
The amount of tension and excitation is related to the thickness of the myocardium; which is based on how much pressure that chamber must generate for circulation.
-
•
Circulation between the right and left primer-pumps is prevented by a septum (septal wall), also myocardium, that is thinner than the outer myocardial wall; and also thicker in the ventricles than the atria.
-
•
Circulation direction is guided by four one-way valves. Circulation occurs due to pressure gradients - there is nothing inherently directional about pressure gradients other than high pressure to low pressure - therefore the valves are necessary to keep blood flowing from a chamber to the next chamber and now ”backwards”.
-
•
All circulation from the gut and lower extremity passes through the descending aorta; and comes to the heart through the inferior vena cava.
-
•
All circulation from the upper extremities and head passes through the great vessels (first three branches off of the aorta); and comes to the heart from the superior vena cava.
-
•
For blood to flow through the circulation, venous pressure must be lower than arterial pressure
-
•
Venous pressure (systemic in the RA; pulmonary in the LA) refers to the pressure that is the final end point for all venous circulation returning to the heart which must, for circulation to occur, have the lowest venous blood pressure of the respective circulations ( when the RA is not generating tension).
-
•
Ventricular systolic pressure refers to the pressure in the ventricles during active tensioning (contraction), for circulation to occur it must have the highest arterial pressure of the respective circulations. The right sided ventricular systolic pressure is lower than the left sided ventricular systolic pressure, the respective circulations are considered low and high pressure.
-
•
Because the ventricular systolic pressures must be the highest through the circulation, the tricuspid valve (between the RA and RV) and the bicuspid (mitral) valve (between the LA and LV) have additional support supplied by the papillary muscles and chordae tendonae (the support does not help them open, it prevents them from allowing backflow while closed).
-
•
Because the LV has greater pressure than the RR, the mitral valve papillary muscle and chordae tendonae are more developed
-
•
The aortic valve, which is not supported by papillary muscle, is under more pressure than the tricuspid valve because the aortic pressure is the second highest pressure in the circulation, however aortic peak pressure is short lived because of how rapidly blood flows out of the aorta.
9.2 Cardiac Output
Circulation is measured and assessed based on the cardiac output () in liters (or mL) per minute. is the flow of blood through the circuit, hence the circulation. is directly proportional to the overall pressure gradient and inversely proportional to resistance to circulation. A conceptual understanding of circulation based on () and the major determinants of, and factors influencing () facilitates an understanding of both normal and abnormal circulation.
| (9.1) |
In Equation 9.1:
-
•
is pressure in the arteries (arterial pressure, which is highest in the aorta)
-
•
is central venous pressure, commonly taken as the pressure in the right atrium (RA)
-
•
is the total peripheral resistance of the vascular circuit
Equation 9.1 is based on Ohm’s Law and points attention to the influence of the driving forces for flow (the pressure gradient) and the resistance to flow. Based on the equation it is clear that the pressure gradient is directly proportional to flow (numerator); and resistance is inversely proportional to flow (denominator).
normally approximates to 0. is equivalent to the term (change in pressure, pressure gradient) and when , then . However, in various clinical scenarios does not approximate to 0 so it is useful to keep central venous pressure in mind. If there is an increase in , without a rise in or a drop in then would be reduced.
An equation that represents the cardiac pump viewpoint of () is:
| (9.2) |
In Equation 9.2:
-
•
is heart rate in beats per minute (bpm)
-
•
is stroke volume (the amount of blood pumped during systole) in mL
Equation 9.2 is also easier to confirm, by unit analysis, that these values equate to cardiac output in mL/min.
| (9.3) |
The left side of Equation 9.3 is based on the output of the heart (cardiac) and the right side is based on the pressure gradient generated by the closed vascular circuit and the resistance encountered by the circulating blood. To keep the two sides of Equation 9.3 equal (balanced) an increase in must be balanced with resultant changes in at least one of the other parameters.
Question: Conceptual Understanding
What changes could occur if increases to keep Equation 9.3 balanced? What changes could occur if decreased to keep Equation 9.3 balanced?
Equation 9.3 is a model and is useful to a point. A challenge with this equation, really all of the equations used in physiology, is that the variables are not independent of one another. They are useful for reasoning about the concepts, but not in an exhaustive way. For example, you may have just figured out that to keep Equation 9.3 balanced when increases, could increase. It turns out that is not independent of . If increases then does tend to increase based on the relationship between arterial pressure and cardiac output.
9.2.1 Arterial Pressure ()
Equation 9.1 simplified under the condition of can be manipulated to provide an equation for arterial pressure:
| (9.4) |
Arterial pressure is blood pressure (). Equation 9.4 shows that blood pressure is directly proportional to cardiac output and total peripheral resistance (). It is hoped that seeing the centrality of blood pressure in the equations for will inspire future clinicians to respect the potency and value of measurement in clinical practice. All measured changes in blood pressure (arterial pressure, ) can be inferred to represent changes in either cardiac output, or total peripheral resistance, or some combination.
Since the heart has two phases - a filling phase known as diastole, and a pumping phase known as systole - it creates pulsatile flow. Systole occurs when the is being ejected from the heart. Pulsatile flow creates a rhythmic pulse in with a peak value referred to as systolic (SBP) and a low value referred to as diastolic (DBP). It is useful to consider SBP and DBP separately, as well the mean arterial pressure (MAP):
Mean Arterial Pressure
| (9.5) |
MAP is a weighted average blood pressure (average arterial pressure) based on the measured values SBP and DBP. DBP has a stronger influence on MAP than SBP because the time period that circulation is in systole is much shorter than the time they are in diastole. With an increase in heart rate () the time in systole becomes proportionally more time but the systolic time interval is relatively unchanged. The change in overall time in systole is based on there being less time in diastole. Despite this there is no modification to the equation for MAP during periods of higher .
Pulse Pressure
Pulse pressure (PP) is often considered clinically as the driving pressure for blood flow. PP is calculated as the difference between SBP and DBP ().
Therefore Equation 9.5 for MAP, can be simplified to:
| (9.6) |
9.2.2 Poiseuille’s Law
Poiseuille’s Law offers deeper insight into and Equation 9.1. The benefit of this insight is the ability to break down the factors that determine .
| (9.7) |
In Equation 9.7:
-
•
is vessel radius to the fourth power
-
•
the viscosity of the fluid (blood)
-
•
length of the vessel
-
•
is the mathematical constant that is the ratio of a circle’s circumference to its diameter, approximately equal to 3.14159
In Equation 9.7 is directly proportional to the pressure gradient () as in Equation 9.1 as well as to vessel radius to the fourth power (); it is inversely proportional to the viscosity of the fluid () and the length of the vessel ().
Poiseuille’s Law includes all the components of Equation 9.1. is the pressure gradient between arteries (primarily aorta) and the right atria. Everything else in Equation 9.7 further elucidates components of as resistance ():
| (9.8) |
The physiologically relevant variables of Equation 9.7 for circulation are , and . is a constant and therefore does not contribute to our understanding of how circulation changes. And for all intents and purposes is a constant since variation in vessel length is not utilized to regulate circulation.
9.3 Regulation of Cardiac Output
In this section we consider the factors that influence, and thus can be used to regulate, cardiac output () as a measure of circulation. Both the quantity (how many liters / minute) of blood being circulated as well as the distribution of that circulation throughout the body. Under normal circumstances all capillaries receive circulation. However, the proportion of circulation received in areas of the body is adjusted to meet local needs. The regulation of quantity and distribution is coordinated and includes overlapping regulated variables. In general, the quantity of cardiac output and its distribution is adjusted to meet the metabolic demands of the body. While the circulation serves many other purposes, it is the moment to moment need to deliver oxygen and remove carbon dioxide (which are metabolically determined) that predominates the need for circulation and cardiac output. The maximum value of represents the maximal functional capacity of the circulatory system to meet the demands of physical activity.
Warning: Example of Quantity vs. Distribution: Vasovagal Syncope
Vasovagal syncope is passing out, losing consciousness, due to a low blood pressure due to an emotional trigger. It is an example of a situation where there is not appropriate coordination between the regulation of and its distribution. With vasovagal syncope many areas of the body are attempting to get more circulation all at once. This results in widespread vasodilation that reduces despite no increase in . The drops enough that circulation to the brain is reduced and there is a temporary loss of consciousness. The loss of consciousness usually results in a movement (falling) and a position (on the ground) that increases by increasing the amount of blood returning to the heart. Once unconscious the emotional trigger is no longer present and the vagal outflow that triggered a drop in is removed, and reflexes that increase in response to a drop in kick in to increase . The combination of increased and increase and restore brain circulation (See Equation 9.4).
9.3.1 Cardiac Output: Quantity
Equipped with the concepts from the previous section the various ways in which the quantity of cardiac output, as a measure of circulation, is regulated can be addressed. Normal resting is approximately 4 to 8 liters per minute (L/min).
Cardiac Index also can be described relative to body mass as the cardiac index (CI), the amount of blood pumped per minute per square meter of body mass. Normal CI is between 2.5 and 4.2 . This wide normal range makes it possible for to decline by almost 40% and still remain within the normal limits. Although several factors interrupt a direct correlation between CI and functional aerobic capacity, CI below 2.5 represents a marked disturbance in cardiovascular performance and is always clinically relevant.
| (9.9) |
Equation 9.9 provides all of the variables for consideration in the regulation of cardiac output.
Heart Rate times Stroke Volume ()
Heart rate and stroke volume (the left side of Equation 9.9 has previously been referred to as the viewpoint from the cardiac pump. The factors influencing these variables is covered briefly here and in more depth in Chapter 10. Normal resting is approximately 4 to 8 liters per minute (L/min), with a resting of 70 beats per minute (bpm); resting is approximately 71 mL/beat.
Heart rate is adjusted by the coordinated regulation of the autonomic nervous system (ANS). Both the sympathetic (adrenergic) and the parasympathetic (cholinergic) branches of the ANS influence the heart rate, as well as endocrine influences from the sympathetic ANS (epinephrine and norepinephrine). In general, the sympathetic nervous system increases heart rate (positive chronotropy) and the parasympathetic nervous system decreases heart rate (negative chronotropy).
Stroke volume is adjusted by changes in cardiac contractility, venous return, referred to as preload, and resistance to ejection from the heart, referred to as afterload. Cardiac contractility increases with sympathetic nervous system activity and through an increase in passive tension with increased preload (increased cardiac filling). Afterload varies directly proportionally with arterial pressure.
The factors that influence heart rate and stroke volume are discussed with more depth in Chapter 10 on the Cardiac Pump.
Pressure Gradient ()
The pressure gradient for cardiac output is regulated through the regulation of arterial pressure. The central venous pressure is kept at approximately 0 due to the Frank-Starling law. The Frank-Starling law is that the volume of blood leaving the heart equals the volume of blood returning to the heart. Under that condition the pressure at the right atrium is kept near 0. The Frank-Starling law also contributes to the arterial pressure (systolic). If more blood returns to the heart (higher preload) then there is more contractility and a higher stroke volume which result in a higher systolic arterial pressure. The combination of an elevated systolic arterial pressure with a central venous pressure of 0 assures greater cardiac output (greater circulation flow). As we will see, the regulation of arterial pressure is the primarily monitored (sensed) variable for the homeostatic regulation of circulation.
Vessel Radius to the fourth power ()
The radius of the circulation is a strong contributor to, and is inversely proportional to total peripheral resistance (). The small arteries, arterioles and pre-capillary sphincters have the greatest capability of adjusting their radius. And, since these vessels make up the largest total cross sectional area of the vascular circuit, changing the radius of many arterioles and pre-capillary sphincters has a large effect on (recall the events Vasovagal syncope described above). During muscular activity that requires an increased cardiac output for the delivery of more oxygen and removal of more waste products, an increase in the radius of local arterioles and pre-capillary sphincters ensures that the is maintained.
Blood Viscosity ()
Viscosity () is directly proportional to resistance. An elevated hematocrit (larger proportion of blood is red blood cells and less is plasma) can increased blood viscosity. For example, an isosmotic volume contraction that increases hematocrit and plasma protein concentration would result in thicker blood which would create additional resistance to flow. In such circumstances, greater pressure is required to propel the higher viscosity blood.
9.3.2 Cardiac Output: Distribution
Regional demands for tissue perfusion (based on local metabolic needs) compete for circulation, and total quantity of adjusts to meet these demands however local blood vessels determine distribution. Distribution simply follows the path of least resistance. That path is determined by arterial vasomotor tone and the degree of vasodilation or vasoconstriction throughout all of the arterioles and pre-capillary sphincters. When the of the active muscle arterioles and pre-capillary sphincters increases, the resistance decreases. This both helps maintain and helps to distribute circulation to the area needing it the most.
Increased metabolic rate increases levels of , decreases levels of , decreases pH, and increases levels of lactic acid at the tissue level dilate local blood vessels and therefore increase distribution to that area. The number of arterioles dilating due to local input is related to the drop in peripheral resistance and influences both venous return and the response, which then influences cardiac pump function.
9.4 Blood Pressure Regulation
With all of this talk about cardiac output as a measured variable of circulation the reader may come to think that the body has sensors that analyze the cardiac output. That is not the case. If cardiac output is not sensed, then it cannot be directly controlled. A homeostatic system requires that a variable be sensed to be regulated. Cardiac output is not directly sensed. There is no sensor in the aorta that keeps track of the of blood leaving the heart. Regulation of cardiac output occurs primarily through the regulation and adjustment of blood pressure.
From a regulation perspective Equation 9.4 is a starting point for understanding how circulation regulation is achieved and how blood pressure is the primarily monitored variable. Blood pressure is monitored directly by baroreceptors (mechanoreceptors) located in the heart, great vessels, and intrathoracic and cervical blood vessels; and indirectly in the kidneys. Monitoring of blood pressure in the kidneys occurs by monitoring the glomerular filtration rate (GFR) which is related to renal circulation.
Expanding Equation 9.4 by adding the variables that determine and we can derive a useful equation for thinking about circulation regulation through blood pressure regulation.
| (9.10) |
is the end diastolic volume (EDV) multiplied by the fraction of EDV ejected (EF) during systole:
| (9.11) |
Since (viscosity) is relatively stable, is very stable, and is a constant:
| (9.12) |
Vessel Compliance
The above reasoning has left out - for the sake of simplicity - the concept of compliance. The regulation of vessel radius occurs through changes in vascular tone (smooth muscle in vessel walls, primarily arterioles to a lesser extent venuoles). Increased vascular tone decreases the radius and decreases its compliance. Therefore the increase in pressure goes beyond the reduction in cross-sectional area associated with the change in the radius. Decreased vascular tone increases the radius and increases its compliance. Therefore the decrease in pressure goes beyond the increase in cross-sectional area associated with the change in the radius.
9.4.1 Neural Regulation of Blood Pressure
Autonomic Neuroendocrine Input
The autonomic neuroendocrine system influences the heart and blood vessels via direct neural connections and through circulating hormones. The parasympathetic (cholinergic) system has direct neural input through the cardiac branch of the vagal nerve (Cranial Nerve X). Vagal nerve activity generally decelerates cardiac function, thus decreasing , speed of the conduction wave of excitation and to a lesser extent contractility (rest and digest). The parasympathetic system does not have an endocrine component (no hormones).
Sympathetic (adrenergic) system neural input is through the thoracolumbar sympathetic system and increases and contractility, thus increasing cardiac output (fight or flight). The sympathetic nervous system also has connections to the peripheral vascular (arteries, arterioles, veins, venuoles). Therefore the sympathetic nervous system can change peripheral resistance, which changes vascular pressure and can alter venous return. The sympathetic system also activates the adrenal gland which then releases adrenaline and noradrenaline into the blood for a longer lasting endocrine (hormonal) response.
Background: Semantics of the Autonomic Nervous System
The autonomic nervous system (ANS) is thus named because it is ”self governing” - meaning, involuntary. Autonomic can sometimes be confused with automatic which is only true depending on what you mean by automatic. Automatic means capable of operating without external control. The autonomic nervous system is not really capable of operating without external control because it exists in situ.
The sympathetic branch of the ANS includes the hormones adrenaline and noradrenaline released from the adrenal glands (epinephrine and norepinephrine) and can also be referred to as the adrenergic nervous system. The receptors the adrenergic nervous system acts on are called adrenergic receptors.
The parasympathetic branch acts using acetylcholine (neurostransmitter, not a hormone) and is also called the cholinergic nervous system. The receptors it actos on are called cholinergic. Since the predominant parasympathetic nerve is the vagus nerve, this system is also occasionally referred to as the vagal nervous system - particularly in cardiac physiology.
Question: Benefit of Sympathetic Endocrine Response?
Can you explain what the benefit of the sympathetic endocrine response is, as opposed to just a nervous system component?
Baroreflex
The baroreflex is activated through a group of mechanoreceptors located in the heart, great vessels, and intrathoracic and cervical blood vessels. These mechanoreceptors are most plentiful in the walls of the internal carotid arteries. Mechanoreceptors are sensory receptors that are sensitive to mechanical changes, such as pressure and stretch. Increased activity in the mechanoreceptors by high pressures increases vagal output and decreases sympathetic output. This chain of events results in vasodilation, decreased , and decreased contractility. The net effect is lower and , which reduce and therefore . Reduction in activity in the mechanoreceptors by low pressure results decreases vagal output and increases sympathetic output. This chain of events results in vasoconstriction, increased , and increased contracility. The net effect is higher , (as compared to lower sympathetic activity), which increase and therefore . The baroreflex is a quintesstential homeostatic negative feedback system - elevated promotes reduced , and reduced promotes elevated . It is the fast acting regulator of during body position changes that prevents syncope (loss of consciousness) during orthostatic challenges (moving from supine to sit or standing). Dysfunction of any part of the baroreflex can result in orthostatic intolerance (hypotension with position changes) that can include syncope. The baroreflex may also be involved in the poorly coordinated response to orthostatic challenges displayed in postural orthostatic tachycardia syndrome (POTS) where does not drop with position changes, but increases and is sustained at a high level for longer, which when utilized alone to regulate is not the most efficient of effective mechanism.
9.4.2 Renal Regulation of Blood Pressure
Renal regulation of blood pressure includes the maintenance of blood volume and a cascade of hormonal regulators that influence both blood volume as well as vessel radius. Blood volume has a direct impact on blood pressure. At the extreme, no blood in the vascular circuit, no pressure. Hypervolemia in the vascular circuit causes elevated pressure (unless, vasodilation can create enough space to avoid it). The role of the kidneys in regulation is a slower responding, and longer acting, regulatory system.
Renin Angiotensin II - Aldosterone System (RAAS)
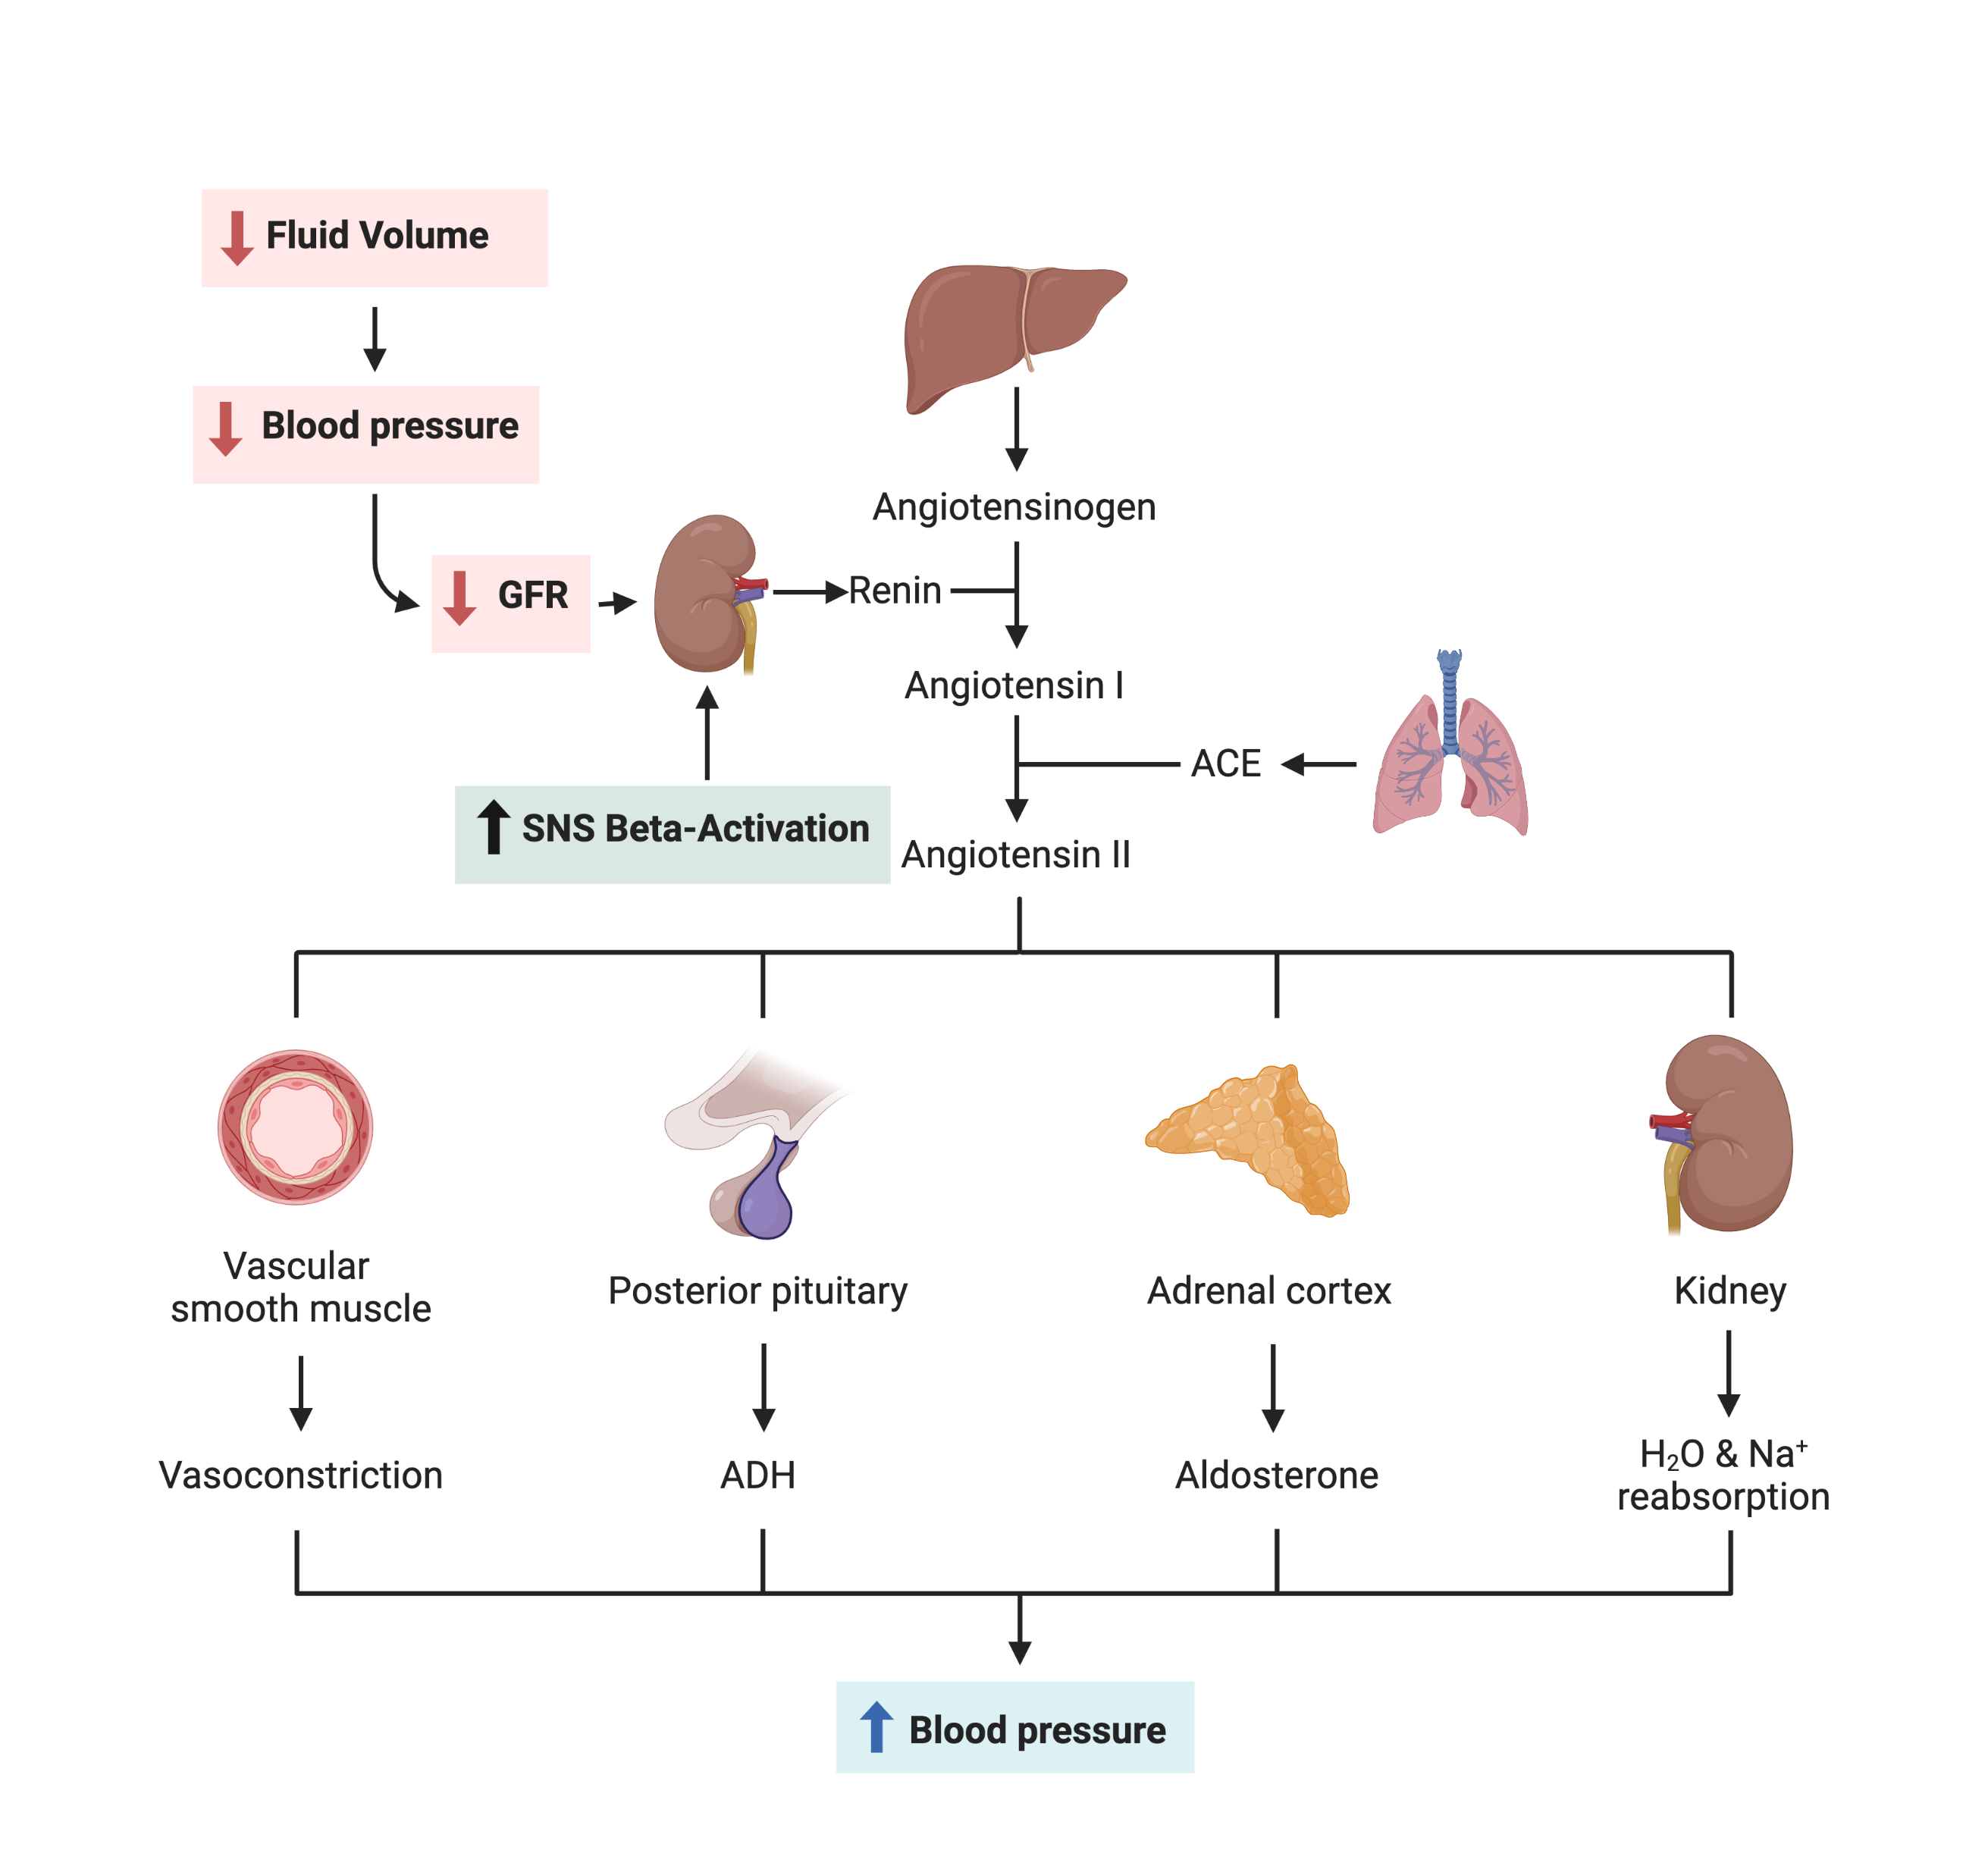
The RAAS system (depicted in Figure 9.2) is initiated in the kidneys in response to reduced fluid volume that decreases , RBF and GFR. The kidneys produce and secrete the hormone renin. Renin activates angiotension I which will be converted to angiotension II by angiotensin converting enzyme (ACE). Angiotension II directly influences kidney function by promoting both and water reabsorption. It also activates aldosterone and ADH and to promote water and reabsorption, and decrease tubular secretion. Angiotension II also directly promotes vasoconstriction of vascular smooth muscle. The overall effect of these events is increased blood pressure through vascular tone and increased blood volume.
Warning: RAAS Gone Wrong - Heart Failure & ACE-Inhibition
The events of RAAS depicted in Figure 9.2 can go wrong. With chronic heart failure (HF) there can be reduced , or even with preserved but lower cardiac output, reduced RBF and GFR, that promotes the secretion of renin by the kidneys. In the context of HF, RAAS increases return of blood to the heart (preload) due to an increased vascular volume. The increased preload adds additional burden to an already failing heart. RAAS also increases the load that the heart must pump against (afterload) due to an increased blood pressure and systemic vasoconstriction. The increased afterload also adds additional burden to an already failing heart. The result tends to be a further reduction in cardiac output and GFR which promotes more renin secretion. This positive feedback loop is far from positive for the health of the individual with HF. In such situations the best course of action for restoring stability is a class of medication referred to a ACE-Inhibitors (ACE-I, i.e. captopril, lisinopril, enalapril) that block the enzyme at converts angiotension I to angiotensin II. ACE-I are also a preferred treatment for HTN (high blood pressure). Rather than forcing diuresis (as a diuretic does, which can create hypokalemia), they prevent anti-diuresis. Anti-anti diuresis is a gentle and physiologically stable approach to diuresis that prevents one of the several deleterious responses to reduced GFR due to HF. The therapuetic benefit of ACE-I goes beyond preventing anti-diuresis and includes reducing the release of aldosterone, and preventing angiotensin II from directly vasoconstricting blood vessels (increasing total peripheral resistance () and diastolic blood pressure (DBP)), and directly resulting in water and reabsorption.
Overall Integration of Renal Mechanisms and Arterial Pressure
Figure 9.3 is a directed graph that depicts the closed loop integration of renal and circulatory systems through the renal regulation of blood volume, and the arterial pressure influence over renal excretion.
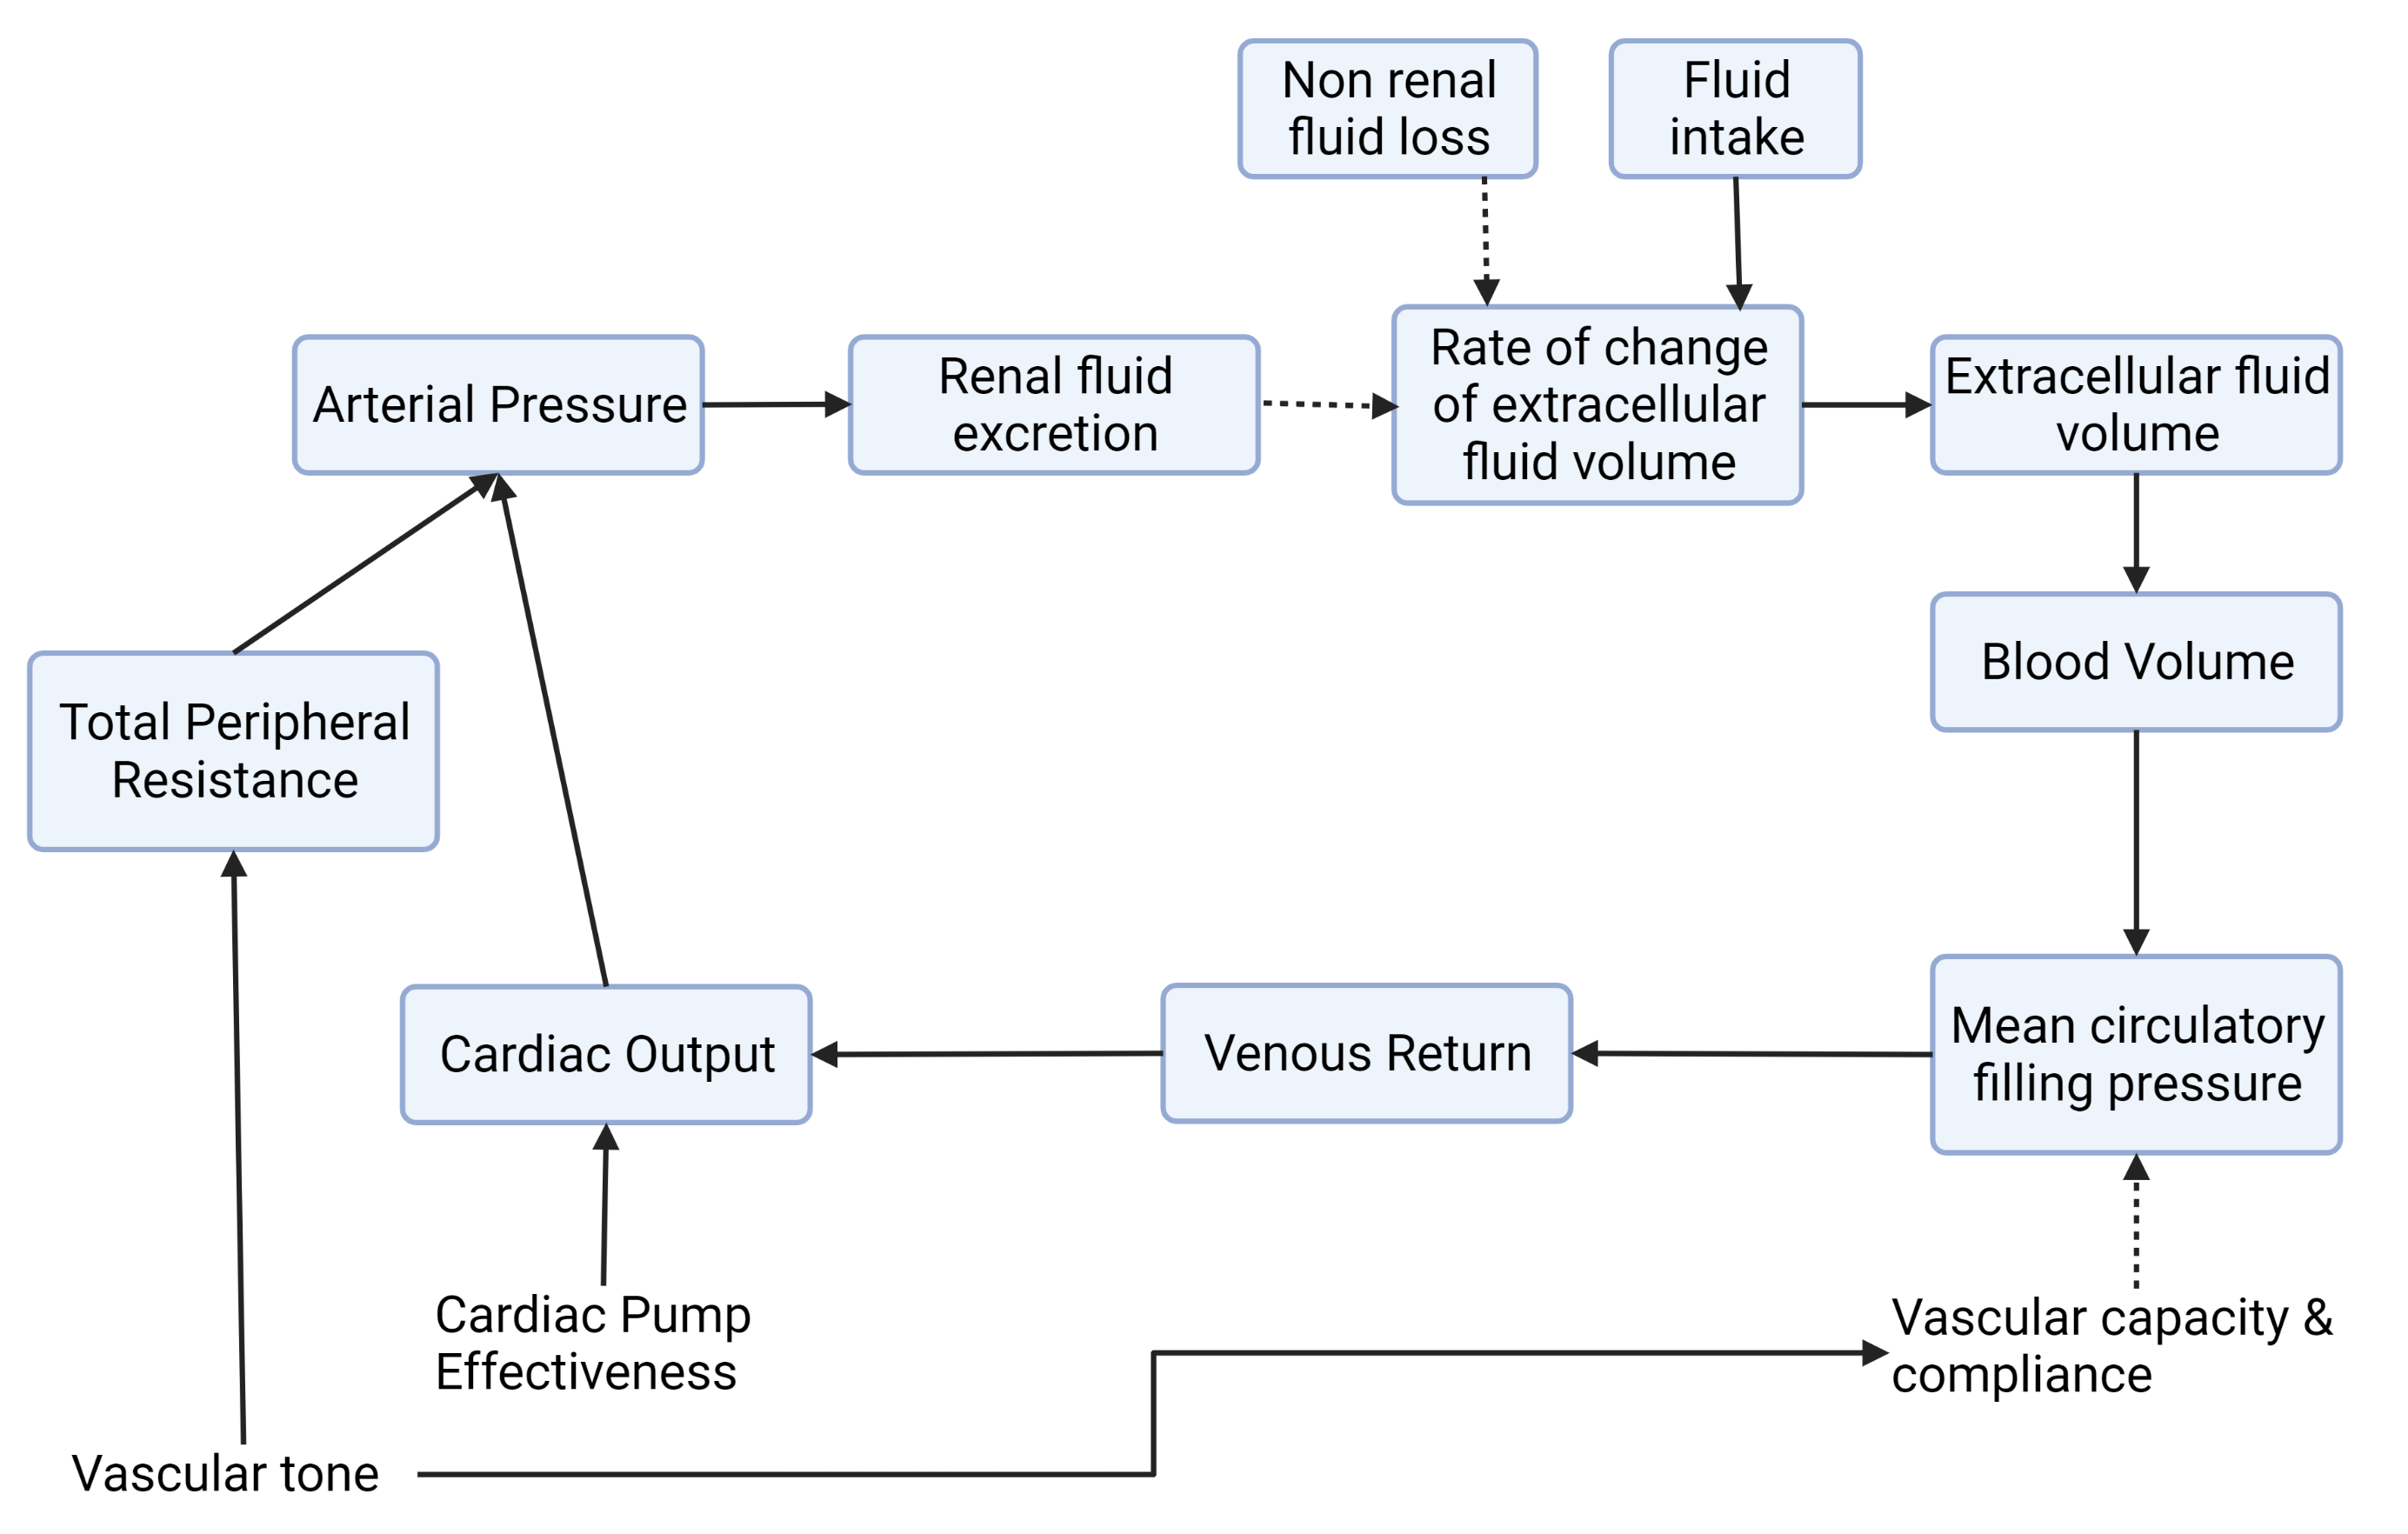
The variables in Figure 9.3 are familiar other than he mean circulatory filing pressure (). is a variable created by Guyton in a model of renal blood pressure regulation [rothe_mean_1993]. is defined as the mean vascular pressure that exists with a stop in cardiac output and distribution of blood until all pressures are the same throughout the system. It is based on the fullness of the circulatory system. A change in is a useful index of a change in overall venous smooth muscle tone if the blood volume is not changed. estimates the pressure in the small veins and venules, which contain most of the blood and account for most of the compliance. In total, provides an estimate of the pressure that determines the rate of flow returning to the heart, independent of cardiac output.
9.5 Cardiovascular Vital Signs
Palpation of Pulses
Palpation of pulses is an important component of a physical examination and can be used to evaluate and identify the following:
-
•
Circulation quality
-
•
Pulse rate and rhythm
Circulation Quality
Pulse are pressure waves through the circulation that are related to both blood pressure and local circulation. Weak pulses can indicate either low blood pressure (overall) or poor circulation that particular region of the body. For example, a weak pulse in the right radial artery but not the left radial artery most likely indicates a local circulation problem in the left UE but not the right. Whereas a weak pulse in all extremities is most likely a low blood pressure overall. A strong, or bounding, pulse can indicate a high blood pressure overall, or a high blood pressure in a particular area. Bounding pulses can also indicate vascular abnormalities such as aneurysms (for example a bounding abdominal pulse is a sign of a descending aortic aneurysm).
Heart Rate & Rhythm
Pulses are correlated with heart rate (cardiac cycle) and rhythm. When palpating a pulse to obtain , counting the pulse rate for 15 seconds and multiplying by 4 is sufficient with normal rates and rhythms. If rates are faster than 100 bpm or slower than 60 bpm, palpate the pulse for 60 seconds. If the rhythm is irregularly irregular (e.g., during AFib) or regularly irregular (e.g., PACs or PVCs), perform auscultation of heart sounds to identify the apical for a full minute. In these cases, palpation of pulse cannot substitute for ECG analysis to monitor the patient’s rhythm, but it may alert the therapist to the onset of these abnormalities.
Use caution in palpating pulses because manual pressure on the carotid sinus may cause baroreflex drops in heart rate (), blood pressure (), or both. In all pulse palpation situations the examiner should start with light pressure and gradually increase pressure until a pulse is felt, and to not exert more pressure than required to feel the pulse.
Some people can feel a pulse in their thumb, therefore it is generally advised to not use the thumb to palpate a pulse.
is the primary means of determining the exercise intensity level for patients who are not taking beta-blockers or who have rate-responsive pacemakers. combined with blood pressure (RPP) is the most appropriate approach to determine exercise intensity in any patient with a known ischemic threshold (even if they are on beta-blockers).
-
•
A linear relationship exists between and work.
-
•
In general, a 20- to 30-beat increase from the resting value during activity is a safe intensity level in which a patient can exercise.
-
•
If a patient has undergone an exercise stress test during the hospital stay, a percentage (e.g., 60%–80%) of the maximum achieved during the test can be calculated to determine the exercise intensity.
-
•
An example of a disproportionate response to low-level activity (bed or seated exercises or ambulation in room) is an of more than 120bpm or less than 50bpm.
-
•
Heart rate recovery (), provides an indication of reduced parasympathetic activity and an indicator of all-cause mortality, can be used to document improvement of tolerance to functional demands. is the absolute difference between peak HR achieved with exercise minus the at 60 seconds after the completion of exercise ( 60 sec). An abnormal at 1 minute, after a treadmill test, is reported to be a decrease of 12 bpm or less with a cool-down period and less than 18 bpm without a cool-down period [collins_cardiac_2019].
-
•
When prescribing activity intensity for a patient taking beta-blockers, consider that should not exceed 20 beats above the resting . If RPP for the patient’s ischemic threshold is known, then the RPP should not be allowed to increase to the ischemic threshold.
-
•
If prescribing an activity intensity, with use of , for patients with an automatic implantable cardiac defibrillator (AICD), remember that the exercise target should be 20 to 30 beats below the threshold rate on the defibrillator.
-
•
should not be used to prescribe exercise status post heart transplantation secondary to denervation of the heart during transplantation.
-
•
Baseline and recent changes in medications always should be considered before beginning an exercise session.
Blood Pressure
Blood pressure is critical to circulation and a primary variable utilized to help regulate cardiac output. Low blood pressure (and low PP) is problematic because it compromises circulation and may indicate hemodynamic compromise due to cardiac (reduced cardiac output), vascular (reduced peripheral resistance) or blood volume problems. High blood pressure can create immediate health care emergencies by placing blood vessels under too much pressure; or cardiac emergencies by causing ischemia (high RPP and myocardial demand), or heart failure (increased afterload). Long term increased high blood pressure (hypertension) leads to long term changes in the heart (left ventricular hypertrophy, fibrosis of the atria and ventricles that makes the heart more susceptible to arrhythmias, or valve dysfunction). Hypertension is a silent killer since many individuals have no idea they have it - which is one of the reasons for the APTA Academy of Cardiovascular and Pulmonary Physical Therapy’s ”Vitals are Vital” campaign to encourage all physical therapists in all settings to make sure they routinely examine vitals signs in all clients.
Measurement of with a sphygmomanometer (cuff) and auscultation is an indirect, noninvasive measurement of the force exerted against the arterial walls during ventricular systole (SBP) and during ventricular diastole (DBP). is affected by total peripheral resistance (blood volume, radius and compliance of arterial walls) and . Table 9.1 includes normal ranges.
| Ranges | Systolic (mmHg) | Diastolic (mmHg) |
|---|---|---|
| Age 8 years | 85-114 | 52-85 |
| Age 12 years | 95-135 | 58-88 |
| Adult | 120 | 80 |
| Elevated (Adult) | 120-129 | 80 |
| Stage 1 Hypertension | 130-139 | 80-89 |
| State 2 Hypertension | 140 | 90 |
Occasionally, measurements can be performed only on certain limbs secondary to the presence of such conditions as a percutaneously inserted central catheter, arteriovenous fistula for hemodialysis, blood clots, or lymphedema (e.g., status post mastectomy).
of the upper extremity should be measured in the following manner [collins_cardiac_2019]:
-
1.
Check for posted signs, if any, at the bedside that indicate which arm should be used in taking . variations of 5 to 10 mmHg between the right and left upper extremity are considered normal. Patients with arterial compression or obstruction may have differences of more than 10 to 15 mmHg.
-
2.
Use a properly fitting cuff. The inflatable bladder should have a width of approximately 40% and length of approximately 80% of the upper arm circumference.
-
3.
Position the cuff 2.5 cm above the antecubital crease.
-
4.
Rest the relaxed arm at the level of the heart.
-
5.
To determine how high to inflate the cuff, palpate the radial pulse, inflate until no longer palpable, and note the cuff inflation pressure. Deflate the cuff. This is an estimate of the systolic pressure. But this method cannot be utilized to obtain a diastolic pressure.
-
6.
Place the bell of the stethoscope gently over the brachial artery.
-
7.
Reinflate the cuff to 30 to 40 mmHg greater than the value in step 5. Then slowly deflate the cuff. Cuff deflation should occur at approximately 2 to 3 mmHg per second.15
-
8.
Listen for the onset of tapping sounds, which represents circulation returning to the brachial artery. This is the SBP.
-
9.
As the pressure approaches diastolic pressure, the sounds will become muffled and in 5 to 10mmHg will be completely absent. These sounds are referred to as Korotkoff sounds (See Table 9.2).
| Phase | Korotkoff Sound | Indicates |
|---|---|---|
| 1 | First sound, faint tapping | Systolic pressure (circulation through compressed artery) |
| 2 | Blowing or swishing sound | Blood is increasing |
| 3 | Distinct tapping | Circulation is increasing |
| 4 | Muffled | Diastolic pressure in certain situationsa |
| 5 | Disappearance | Diastolic pressure in adults |
a
Systolic Blood Pressure / Palp
In situations when it is difficult to auscultate or to obtain a distinct diastolic blood pressure reading (DBP), the palpation method may be utilized and blood pressure is noted as systolic blood pressure (SBP)/Palp. This is the same procedure utilized in Step 5 to determine how high to pump the cuff for a full measurement of blood pressure without having to over inflate the cuff.
9.5.1 Physical Therapy Considerations
-
•
Recording pre exertion, para exertion, and post exertion is important for identification of responses to activity. During recovery from exercise, blood vessels dilate to allow for greater circulation to muscles. In cardiac-compromised or very deconditioned individuals, total may be unable to support this increased flow to the muscles and may lead to decreased output to vital areas, such as the brain.
-
•
If you are unable to obtain on the arm, the thigh is an appropriate alternative, with auscultation at the popliteal artery.
-
•
Falsely high readings occur if the cuff is too small or applied loosely or if the brachial artery is lower than the heart level.
-
•
Evaluation of and in different postures can be used to monitor orthostatic hypotension with repeat measurements on the same arm 1 to 5 minutes after position changes.
-
•
The same extremity should be used when serial recordings will be compared for an evaluation of hemodynamic response.
-
•
A record is kept on the patient’s vital sign flow sheet. This is a good place to check for trends throughout the day and, depending on your hospital’s policy, to document changes during the therapy session.
-
•
An auscultatory gap is the disappearance of sounds between phase 1 and phase 2 and is common in patients with high , venous distention, and severe aortic stenosis. Its presence can create falsely low SBPs if the cuff is not inflated enough (prevented by palpating for the disappearance of the pulse before measurement), or falsely high DBPs if the therapist stops measurement during the gap (prevented by listening for the phase 3 to phase 5 transitions).
-
•
In general there is a lower SBP, higher DBP, and lower workload at any given submaximal during arm exercise compared with leg exercise [dias_differences_2022]
-
•
A clearly disproportionate response to exercise includes SBP decrease of 10 mmHg below the resting value, a hypertensive systolic response of greater than 200 mmHg, or a hypertensive diastolic response of greater than 110 mmHg. A normotensive systolic blood response should increase 5 to 12 mmHg per increase in metabolic equivalents (METs). One MET is approximately 3.5 ml/kg/min of oxygen consumption.
-
•
If the patient is on a pacemaker that does not have heart rate modulation, response can be used to gauge intensity.
9.6 Summary
This chapter has provided introduced circulation from the perspective of cardiac output. The focus has been on the systemic circulation, what leaves the left ventricle and returns to the right atria without much consideration of what the heart is doing in its role as a pump. We simply took it for granted that the heart pumps a volume of blood out with each beat () and it does so a certain number of times per minute (). Circulation is measured by us as cardiac output but is sensed physiologically by the indirect means of . Homeostatic mechanisms are in place that allow the monitoring of to adjust of (chronotropy), through cardiac contractility (inotropy) and venous return (vascular tone through neuroendocrine mechanisms), blood volume (renal and renal endocrine mechanisms) and . Monitoring and provide physical therapists with non-invasive insights. When combined with an understanding of circulatory physiology these insights provide useful information when working with clients both with and without conditions that directly affect the circulation.
Next Step - The Cardiac Pump
In Chapter 10 on the Cardiac Pump we fill in the gap of circulation between the blood entering the right atrium and the blood leaving the left ventricle. This includes the factors the influence heart rate, stroke volume; properties of the cardiac muscle; cardiac circulation and the electrocardiograph to assess cardiac function.
[heading=subbibintoc]
Sample Questions
-
1.
Based on Poiseuille’s Law which factor has both a strong and a highly variable (physiologically adjustable) determinant of peripheral resistance?
-
2.
How is central venous (right atrial) pressure kept at approximately 0?
-
3.
What factors allow the distribution of cardiac output to respond to metabolic demands?
-
4.
What are the implications associated with changes in vascular tone based on altered sympathetic nerve activity change vessel radius and compliance in the same direction (both increase or both decrease)?
-
5.
What is the sequence of events based on the baroreceptor response to standing up from supine?